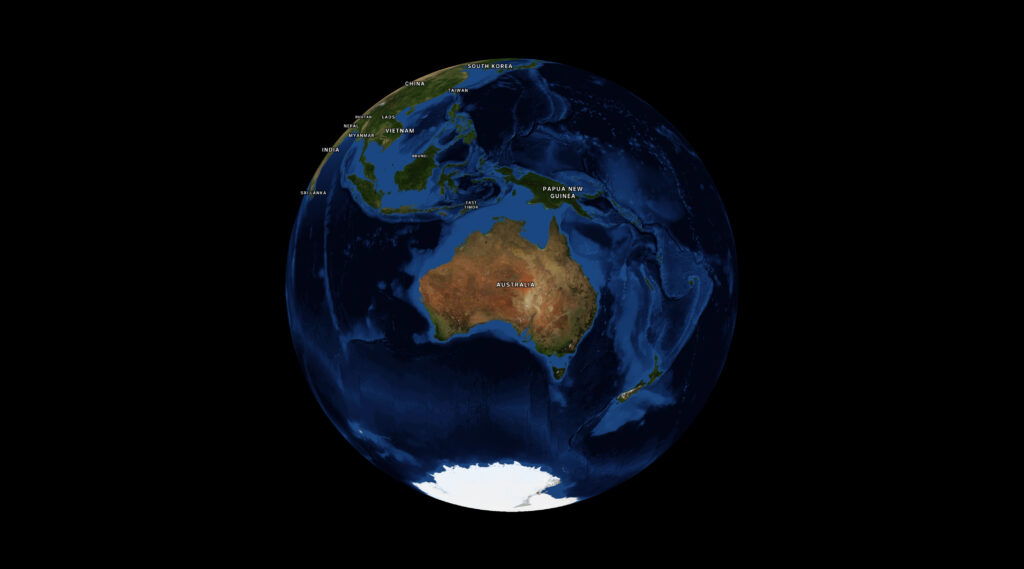
MapLibre introduced a globe mode, which is really cool. But one thing I had a lot of trouble with was making the globe take up all the available screen space without either overflowing or leaving a bunch of whitespace at the sides.
Initially I thought I could call fitBounds with the coordinates on each corner of my globe, but that only worked at latitude 0; once we started panning and zooming around the calculation would break down. This is for several reasons:
- firstly, I was calculating coordinates based on the longitude, but for the latitude I’d just stuck the two poles in, figuring the top and bottom of the map would do. But the poles get visually closer together when you change the latitude. No good.
- in MapLibre the zoom level (
z) affects the map differently depending on your latitude. So at the poles, you need to have a super zoomed outzvalue to see the same amount of globe as you do at the equator. This means you have to calculate the zoom value every time the latitude changes.
This turned out to be too hard and I’d given up a few times, until I started messing around with Antigravity trying to tune my bad algorithm.
Every so often the LLM manages to do something that I would not in a million years. This is something I’ve been agonising over, and with a bit of iteration the damn thing did it with plain maths and known values:
    function fitTheGlobe() {
      if (!mapRoot.map) return;

      const container = mapRoot.map.getContainer();
      const width = container.clientWidth;
      const height = container.clientHeight;

      // 1. Determine how big (in pixels) we want the globe diameter to be on screen.
      const padding = -20; // visually tweak to fit
      const targetDiameterPx = Math.min(width, height) - padding * 2;

      // 2. MapLibre's zoom logic is based on a Mercator projection, which stretches
      // the world as you move away from the equator by a factor of 1/cos(latitude).
      // To keep the globe a constant physical size, we must shrink our target
      // dimensions by cos(latitude) to counteract that internal magnification.
      const lat = mapRoot.map.getCenter().lat;
      const latRad = (lat * Math.PI) / 180;
      const mercatorScaleCorrection = Math.cos(latRad);

      // 3. Calculate the necessary world circumference (in pixels) to achieve
      // our target diameter. On a sphere, Circumference = Diameter * PI.
      const requiredWorldCircumferencePx = targetDiameterPx * Math.PI * mercatorScaleCorrection;

      // 4. MapLibre defines Zoom 0 as a world circumference of 512px.
      // Each zoom level doubles the pixel size (exponential growth: 512 * 2^z).
      // We use Math.log2 to convert that pixel growth back into a linear zoom level 'z'.
      const targetZoom = Math.log2(requiredWorldCircumferencePx / 512);

      const currentZoom = mapRoot.map.getZoom();
      const threshold = 0.01;

      if (Math.abs(currentZoom - targetZoom) > threshold) {
        mapRoot.map.flyTo({
          zoom: targetZoom,
          duration: animationDuration,
          essential: true
        });
      }
    }
I prompted it to split the calculation out and document what’s happening and I think this is a pretty accurate take. The conditional at the end guards against rounding errors and jitter. The vibes feel good.

Look, I don’t fully understand the maths, and there’s a bit more padding the bigger your screen gets. But deeply understanding this is not necessary for me to get my work done so I’m fine with that.
Ultimately it would be nice to have a built-in function in MapLibre, and if I get a moment I’ll see if I can wrap my head around it enough to make a PR back upstream. In the meantime, I hope this helps.


